Page controls
Page content
Table 1: New Complaints Filed by Social Area and Grounds Cited
Total Number of New Complaints 1,776
|
Accommodation |
6 |
5 |
6 |
|
|
4 |
29 |
7 |
32 |
30 |
5 |
38 |
10 |
|
2 |
32 |
1 |
|
207 |
82 |
4.62% |
|
Contracts |
|
|
|
|
|
1 |
1 |
1 |
|
|
1 |
|
|
|
1 |
|
|
|
5 |
2 |
0.11% |
|
Employment |
105 |
98 |
6 |
6 |
26 |
49 |
745 |
177 |
61 |
26 |
153 |
|
337 |
2 |
161 |
383 |
132 |
28 |
2495 |
1226 |
69.03% |
|
Services |
13 |
23 |
6 |
|
|
25 |
390 |
32 |
8 |
4 |
29 |
2 |
53 |
|
6 |
19 |
6 |
6 |
622 |
456 |
25.68% |
|
Vocational Associations |
1 |
|
2 |
|
|
2 |
7 |
|
1 |
|
|
|
|
|
|
1 |
1 |
|
15 |
10 |
0.56% |
|
Total Grounds |
125 |
126 |
20 |
6 |
26 |
81 |
1172 |
217 |
102 |
60 |
188 |
40 |
400 |
2 |
170 |
435 |
140 |
34 |
3344 |
1776 |
100% |
|
Percent of Ground Cited |
3.74% |
3.77% |
0.60% |
0.18% |
0.78% |
2.42% |
35.05% |
6.49% |
3.05% |
1.79% |
5.62% |
1.20% |
11.96% |
0.06% |
5.08% |
13.01% |
4.19% |
1.02% |
100% |
|
|
|
Percent of Total Complaints Filed |
7.04% |
7.09% |
1.13% |
0.34% |
1.46% |
4.56% |
65.99% |
12.22% |
5.74% |
3.38% |
10.59% |
2.25% |
22.52% |
0.11% |
9.57% |
24.49% |
7.88% |
1.91% |
188.29% |
|
|
|
|
Age |
Ancestry |
Association |
Breach of Settlement |
Citizenship |
Creed |
Disability |
Ethnic Origin |
Family Status |
Marital Status |
Place of Origin |
Public Assistance |
Race & Colour |
Record of Offences |
Reprisal |
Sex & Pregnancy |
Sexual Harassment |
Sexual Orientation |
Sum of Categories |
Total Complaints Per Social Area |
Percentage of all Complaints |
Table 2: Settlements by Ground in Cases Mediated in 2002/2003
|
Age |
28 |
$119,404.74 |
$4,264.46 |
|
Ancestry |
16 |
$77,875.00 |
$4,867.19 |
|
Association |
3 |
$8,000.00 |
$2,666.67 |
|
Citizenship |
2 |
$24,000.00 |
$12,000.00 |
|
Creed |
17 |
$65.667.65 |
$3,862.80 |
|
Disability |
272 |
$1,732,205.54 |
$6,368.40 |
|
Ethnic Origin |
39 |
$215,270.00 |
$5,519.74 |
|
Family Status |
17 |
$115,898.25 |
$6,817.54 |
|
Marital Status |
8 |
$116,300.00 |
$14,537.50 |
|
Place of Origin |
25 |
$126,720.00 |
$5,068.80 |
|
Public Assistance |
3 |
$2,000.00 |
$666.67 |
|
Race & Colour |
107 |
$548,725.30 |
$5,128.27 |
|
Record of Offences |
2 |
$14,000.00 |
$7,000.00 |
|
Reprisal |
45 |
$266,562.81 |
$5,923.62 |
|
Sex & Pregnancy |
135 |
$765,620.07 |
$5,671.26 |
|
Sexual Harassment |
41 |
$206,586.51 |
$5,038.70 |
|
Sexual Orientation |
16 |
$72,000.00 |
$4,500.00 |
|
Total for All Grounds* |
776 |
$4,476,835.87 |
$5,769.12 |
|
|
Number Receiving Damages |
Monetary Damages |
Average |
*Note: Because complaints can involve multiple grounds, the total sum of monetary damages by ground exceeds the sum of monetary damages by complaints $2,472,096.26
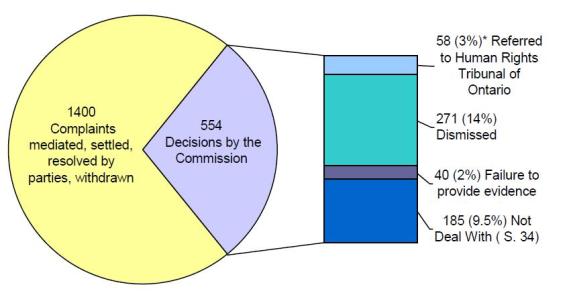
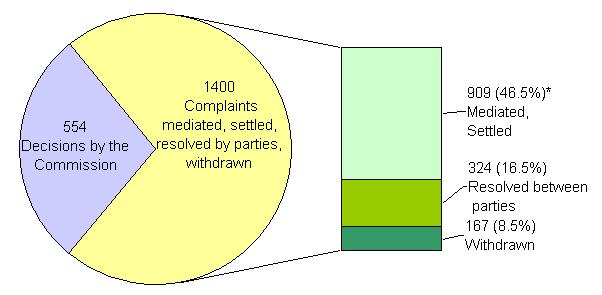
Table 3: Complaints Closed by Disposition and Grounds
Total Number of Complaints Closed = 1,954
|
Dismissed |
16 |
37 |
6 |
1 |
2 |
15 |
125 |
60 |
8 |
3 |
47 |
4 |
119 |
|
18 |
59 |
14 |
18 |
552 |
271 |
13.87% |
|
Failed to provide Evidence |
|
1 |
1 |
|
|
2 |
27 |
6 |
3 |
2 |
3 |
|
13 |
|
2 |
8 |
2 |
1 |
71 |
40 |
2.05% |
|
Not Dealt With – (Sect. 34) |
19 |
20 |
4 |
2 |
|
8 |
113 |
39 |
10 |
8 |
23 |
2 |
82 |
3 |
18 |
36 |
8 |
6 |
401 |
185 |
9.47% |
|
Referred to Human Rights Tribunal |
3 |
6 |
|
|
|
2 |
17 |
8 |
4 |
1 |
4 |
3 |
22 |
|
12 |
38 |
11 |
3 |
134 |
58 |
2.97% |
|
Resolved |
24 |
12 |
10 |
1 |
|
12 |
185 |
30 |
10 |
11 |
21 |
3 |
71 |
1 |
40 |
102 |
25 |
9 |
567 |
324 |
16.58% |
|
Settled |
66 |
51 |
11 |
|
1 |
40 |
550 |
100 |
33 |
18 |
63 |
6 |
244 |
2 |
102 |
277 |
92 |
22 |
1678 |
909 |
46.52% |
|
Withdrawn |
16 |
9 |
2 |
1 |
2 |
12 |
89 |
23 |
15 |
10 |
21 |
2 |
42 |
|
18 |
43 |
11 |
7 |
323 |
167 |
8.55% |
|
Total |
144 |
136 |
34 |
5 |
5 |
91 |
1106 |
266 |
83 |
53 |
182 |
20 |
593 |
6 |
210 |
563 |
163 |
66 |
3726 |
1954 |
100% |
|
Percentage |
3.86% |
3.65% |
0.91% |
0.13% |
0.13% |
2.44% |
29.68% |
7.14% |
2.23% |
1.42% |
4.88% |
0.54% |
15.92% |
0.16% |
5.64% |
15.11% |
4.37% |
1.77% |
100% |
|
|
|
|
Age |
Ancestry |
Association |
Breach of Settlement |
Citizenship |
Creed |
Disability |
Ethnic Origin |
Family Status |
Marital Status |
Place of Origin |
Public Assistance |
Race & Colour |
Record of Offences |
Reprisal |
Sex & Pregnancy |
Sexual Harassment |
Sexual Orientation |
Sum of Categories |
Total for All Complaints |
Percentage of all Complaints |
Note: Because complaints can involve multiple grounds, the sum by grounds exceeds the total for all complaints filed.
Table 4: Complaints Closed by Disposition and Grounds
Total Number of Complaints Closed = 1,954
|
Dismissed |
14 |
4 |
191 |
60 |
2 |
271 |
13.87% |
|
Failed to Provide Evidence |
5 |
|
31 |
4 |
|
40 |
2.05% |
|
Not Dealt with (Sec. 34) |
9 |
1 |
115 |
49 |
11 |
185 |
9.47% |
|
Referred to Human Rights Tribunal |
8 |
|
39 |
11 |
|
58 |
2.97% |
|
Resolved |
12 |
1 |
267 |
43 |
1 |
324 |
16.58% |
|
Settled |
38 |
2 |
799 |
65 |
5 |
909 |
46.52% |
|
Withdrawn |
6 |
2 |
140 |
16 |
3 |
167 |
8.55% |
|
Total |
92 |
10 |
1582 |
248 |
22 |
1954 |
100% |
|
Percentage |
4.71% |
0.51% |
80.96% |
12.69% |
1.13% |
100% |
|
|
|
Accommodation |
Contract |
Employment |
Services |
Vocational Associations |
Sum of Categories |
Percentage of all complaints |
Resolved Cases: Details on Settlements
Breakdown of Commission Decisions